Quantcast
Channel: Data – AmiBroker Knowledge Base
Viewing all 30 articles
Browse latest View live

How to export quotations from AmiBroker to CSV file ?

$
0
0

The easiest way to export quotes to CSV file is to use the below formula from Automatic Analysis window:
(Analysis -> Automatic Analysis)

Filter=1
AddColumn(O,"Open"); 
AddColumn(H,"High"); 
AddColumn(L,"Low"); 
AddColumn(C,"Close"); 
AddColumn(V,"Volume",1.0); 
AddColumn(OI,"Open Interest",1.0); 

  1. Open: Analysis->Formula Editor
  2. Paste the above formula into formula window
  3. Choose Tools->Send to Auto-Analysis menu in the Formula Editor
  4. In Automatic Analysis window select Apply to: All Stocks, Range: All quotations (or any other time range or filter, depending on what you need to export)
  5. Press Explore button
  6. Press Export button, specify the name and press OK

How does the intraday-to-daily compression work?

$
0
0

When you are using intraday database daily candles are usually constructed by time-compression of intraday (for example 1-minute data). AmiBroker offers lots of flexibility when it comes to defining intraday-to-daily time compression.

Intraday Settings Window (File -> Database Settings -> Intraday Settings) allows you to control the display of intraday data. Different filtering and data-compression settings result in different appearance of the chart and data being included in the compressed DAILY candle.

This article explains how to use this feature effectively.

First, let us check how Filtering works - AmiBroker collects all the data within the local database, but displays only those data which are inside selected trading hours start-end time. Please note that these settings affect all charts and windows except Quote Editor that always displays all available data.

  • Show 24 hours trading (no filtering) – all data is displayed (no filtering at all). In this case, all the data (including pre- and after-market quotations) is shown on the chart, and all the quotations are compressed to the daily bar.

24 Hours - Daily compression uses Exchange time
 

As a result – all the data (since 00:00 untill 23:59) is included on the intraday chart. Now, if we switch the display into DAILY interval, all these quotes will be compressed to the daily candle.

As it is visible in the tooltip - the OHLC values shown for the 2006-03-14 candle match the values observed on the intraday (5-min) chart.

  • Show day session only – only the data between day session (RTH) start and end times is displayed. If we apply such kind of filtering, the quotes outside the regular session hours are not included in the charts.

These are the settings we want to use if we are interested in getting daily bar representing standard US stock markets trading hours (9:30 open, 16:00 close). If we switch the display to DAILY interval, the influence of the filtering settings can also be observed.

As it is visible in the tooltip - the OHLC values shown for the 2006-03-14 candle match the values from 9:30 upto 16:00 observed on the intraday (5-min) chart.

  • Show night session only – only the data between night sesison (ETH) start and times are displayed. The below chart shows only the data between start and end times of the Night session defined in the settings.

Since only Night-session data is displayed in the charts, consequently, such data will be included in the Daily candle when we switch the display interval to DAILY.


Daily candle includes all the quotes for 2006-03-14 (marked with yellow background on the previous / intraday picture)

Now we will examine how does the time-shift affect the daily compression. Let us consider the Europe-based investor in GMT+1 time zone. There is a 6 hours difference, that is – when the regular session starts in US at 9:30, the time here is 15:30. That’s what the time-shift setting is for. If one wants to, it’s possible to display the quotations in the local time.

Time shift - is the time difference (in hours) between your local time zone and the exchange time zone. So – let’s set the time-shift to 6 hours and check what’s the influence of this setting on the daily compression.

AmiBroker allows us to choose, whether the daily time-compression uses Exchange time or Local time.

  • Exchange time – daily data are constructed from intraday bars starting from 00:00 and ending at 23:59 in the EXCHANGE (or data source) TIME ZONE. This situation is presented in the screenshot below:


The yellow shade shows the bars which are used to build the 2006-03-14 daily candle. Despite the fact that the day expressed in Local time starts at 00:00, daily time-compression uses EXCHANGE time (so in local time, the new trading day starts at 6:00 and ends at 5:59, which is just 00:00 shifted by 6 hours). Consequently - if EXCHANGE time is used for the daily compression then the Daily bar will look exactly the same as in US-time (first example in this article).

As you can see – the Open, High, Low, Close prices of the 2006-03-14 daily candle are exactly the same as in Example 1, when there was no time-shift used. This is because the compression still uses EXCHANGE 00:00 – 23:59 range, which is expressed as 6:00 – 5:59 in local time.

  • Local time – daily data are constructed from intraday bars starting from 00:00 and ending at 23:59 in the LOCAL (computer) TIME ZONE.

As opposed to the previous example – now AmiBroker uses 00:00 – 23:59 range expressed in Local time. That will produce a different daily candle.

It’s also possible to use Day/Night session times defined in the settings for daily compression purposes. Then daily candles are constructed from the intraday bars that start at the start time of night session (previous day) and end at the end time of day session). So – if we define the day session to start at: 9:30 and finish at 16:00 and night session times as 16:01 – 9:29, then the daily candles will be built from all the intraday bars from the start of the night session on the PREVIOUS day till the very last bar of the day session of the CURRENT day. Such setup is popular in Forex markets where Monday’s daily bar actually starts with Sunday evening trading (which starts from 17:00 ET) and continues till the end of Monday’s day session, and so on for each next day.

And the daily candle of March 14th shows these values – so the daily compression uses time range from: March 13th (previous day) 16:01 to March 14th (current day), 16:00.

See also:
Detailed setup instructions for Tokyo-based Forex traders using eSignal feed.

AmiBroker for FOREX

$
0
0

Here is an article that tells you everything you need to know about using AmiBroker for trading FOREX markets.

I. DATA

AmiBroker is very flexible as regards the datasources that can be used to feed data to the program.

1) Realtime data

Forex traders usually require a realtime datasource and with AB you have a variety of choices.
The exact configuration process depends on the particular source – click on the appropriate link to learn how to configure the source of your choice:

- eSignal – http://www.amibroker.com/video/esignal.html 
- IQFeed – http://www.amibroker.com/iqfeed.html
- Interactive Brokers – http://www.amibroker.com/video/ib.html
- any source that supports DDE standard (this is a generic communication interface, check if your broker’s application supports DDE) – http://www.amibroker.com/dde.html
- any source that delivers the data in MetaStock format – see:
http://www.amibroker.com/guide/h_extsources.html


2) AmiQuote downloader

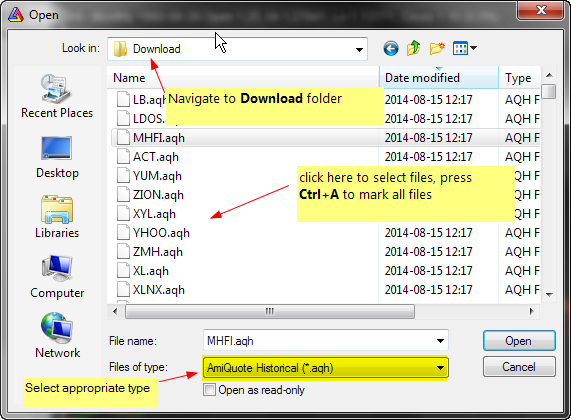
If you do not require realtime quotations, but it’s enough for you to have the historical data (e.g. for backtesting your strategies) – then you can also use AmiQuote downloader program (a companion program that is installed with AmiBroker) and it will allow you to get FREE forex data (both EOD and intraday: 1-, 3-, 5-, 15-, 30-, 60- and 120-minute intervals).

AmiQuote can download the quotations for the following currency pairs:
EURCHF,EURGBP,EURJPY,EURUSD,GBPUSD,USDCHF,USDJPY

The download process is shown in the video:
http://www.amibroker.net/video/forex.html

You need to do the following:
- set up database in AmiBroker (File -> New Database, local database, base
time interval, e.g. EOD)
- run AmiQuote (START -> Programs -> AmiBroker -> AmiQuote )
- add forex symbols in AQ: (Edit -> Add tickers )
- select FOREX as a datasource
- select time range
- check “Automatic Import” field
- choose: File -> Start download
The intraday forex quotes are available in the Registered version of AmiQuote only.
Although the entire data range is very long, you must remember that in case of intraday quotes the saefst way is to get data in small parts, few weeks at a time.
Otherwise the request may be too large for the data server to handle it and as a result it will reject the request.
The other important thing to remember is that the data is not avalable for downloads between 13:00 – 22:00 GMT time (7:00 – 16:00 EST) – in these hours the data  vendor’s  server just rejects all the requests for intraday quotes.


3) Text files.

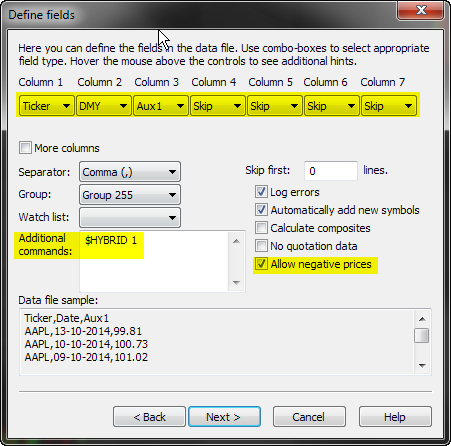
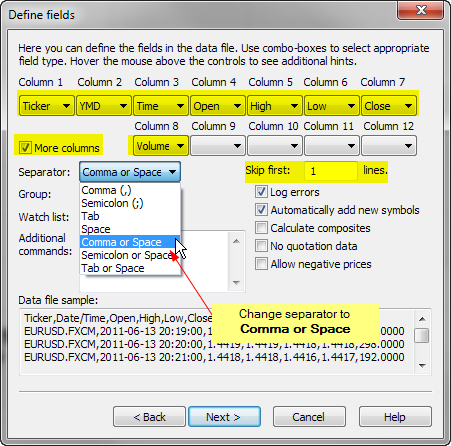
You can also use any data that comes in the text files. The ASCII Importer available in AmiBroker is very flexible and accepts practically any standard of data.
To import quotations – the most convenient is to use File -> Import Wizard.

To learn more about importing the data from ASCII (text) files – please read the following tutorial:
http://www.amibroker.com/guide/w_impwizard.html
 

II.  SYMBOL GUIDE

Once you configure the database (to read realtime data), then all you need to do is to add the symbol via: Symbol -> New menu and AmiBroker will automatically read the data for the selected symbol. Please note that various datasources have different symbology, so please always refer to the data vendor’s Symbol guide to learn about the required symbol format.

Here you will find the links to the most popular vendors guidlines:

- eSignal:
http://www.esignalcentral.com/support/symbol/symbol_format.asp#forexGarban
http://www.esignalcentral.com/support/symbol/forex.asp

- IQFeed:
http://www.iqfeed.net/symbolguide/index…

- Interactive Brokers:
http://www.amibroker.com/ib.html
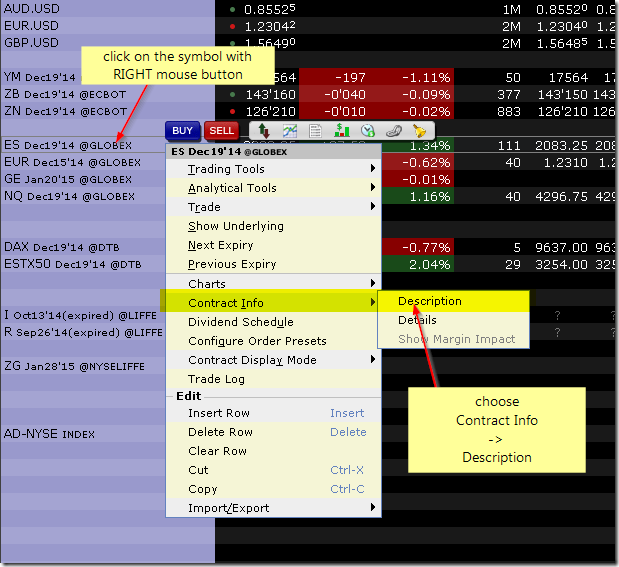
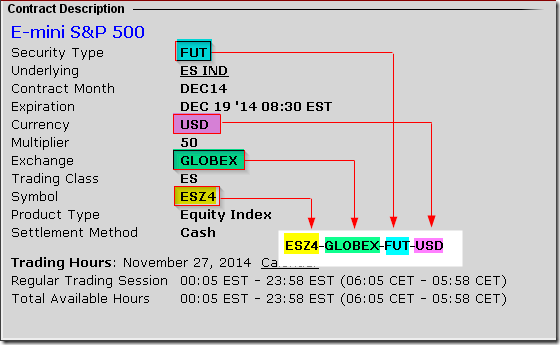
In case of Interactive Brokers – if you have any doubt what format to use -
you can easily check any symbol in IB.

Just enter the symbol in Interactive
Brokers TWS, then change the view to Symbol mode
(View -> Symbol mode). Now you can compose the actual symbol out of three
fields:

SYMBOL-EXCHANGE-TYPE
where:
SYMBOL is the same as the symbol column as displayed in TWS while under
symbol mode
EXCHANGE is the exchange d in TWS while under symbol mode
TYPE  is one the following: STK – stocks, FUT – futures, FOP – options on
futures, OPT – options, IND – indexes, CASH -cash (ideal FX)


III. CHARTING

Since most currency pairs requires 4 decimals to display the rates properly, it’s necessary to set-up AmiBroker accordingly. The number of decimal places can be defined  in Preferences dialog in:

Tools -> Preferences -> Miscellaneous

The changes will also affect such tools as Fibonacci Extension or Retracement drawing tools.


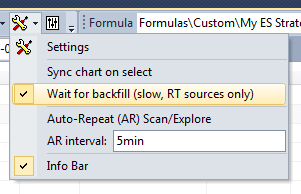
IV. SCANNING and DATA EXPLORATIONS

AmiBroker allows you to perform sophisticated scanning and data explorations (both in realtime and with use of historical quotes). To perform data analysis and display the values of chosen indicators in the customized table – we can use Automatic Analysis window. The detailed description on how to perform explorations is available at:
http://www.amibroker.com/guide/h_exploration.html

As a short example – we will find the crossovers of MACD and its Signal line and additionally – display values of the symbol we test. The 3rd parameter of AddColumn() function allows to customize the number of places after decimal point, so it’s possible to specify if we need 2 or 4 decimal places. If we use:

AddColumn( Close, “Close”, 1.4);
then – 4 decimal places will be displayed. On the other hand – if we use:

AddColumn( Close, “Close”, 1.2);
then AB will display only 2 decimals.

To perform the test - it’s necessary to do the following:
- open the Formula Editor (Analysis -> Formula Editor)
- enter the formula:
Buy CrossMACD(), Signal() );
Sell CrossSignal(), MACD() );
Filter Buy OR Sell;
AddColumnClose"Close"1.4);

- Tools -> Send to Auto-analysis
- select the time-range of the exploration
- press EXPLORE

As a result – we will get a list of MACD/Signal crossover points and the value of the chosen symbol on that bar.

V. BACKTESTING

First of all, it’s necessary to enter the symbol-specific information into Symbol -> Information page (individually for each ticker). In case of currencies denominated in USD (like EURUSD) the following settings should be used:

- Round lot size should be equal to 1 

Tick size should be set to pip value equal 0.0001 for currencies with four decimal digits and to 0.01 for currencies with two decimal digits (so in case of EURUSD it’s 0.0001).

- Point value should be set to to the dollar value of a single pip divided by pip so for EURUSD it will be:
             10$ / 0.0001  =  100000

Margin Deposit in most cases should be set to 1000 (1% margin from $100’000)


1) Currencies denominated in USD

Let’s analyse the results generated by a simple formula (a crossover of 12- and 24-day Moving Averages of Closing price, trading 3 contracts at a time). To perform a backtest – it’s necessary to do the following:

- open the Formula Editor (Analysis -> Formula Editor)
- enter the formula:
Buy CrossMA(Close12) , MAClose24) );
Sell CrossMA(Close24) , MAClose12) );
SetPositionSize(3spsShares );

 - choose: Tools -> Send to Auto-analysis

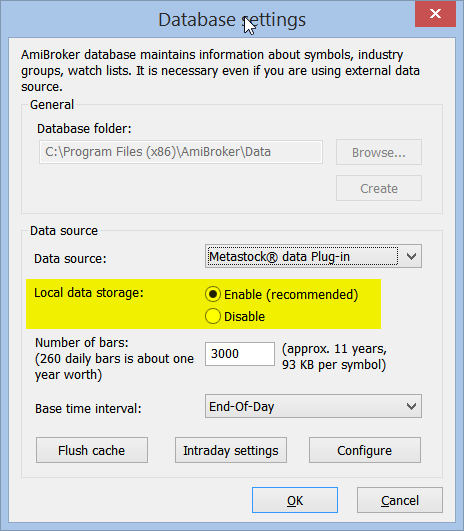
As a result – the Automatic Analysis window will open. In the settings dialog (SETTNGS button) it’s necessary to turn on the FUTURES MODE (in order to use the information entered into the Information dialog) and define the Initial Equity.


then – press OK. In the AA window main screen it’s necessary to define the time range of the backtest and the symbols included in the test. For our example that will be: Current Symbol, All quotations

Then – once everything is configured – press BACKTEST button. Now let’s have a look at the results list.
The profit is calculated as follows:

NumContracts * (SellPrice – BuyPrice) * PointValue


In the first transaction:
- the Entry Price is equal to 1.2154
- the Exit Price is equal to 1.2304
- NumContracts3 (since we trade 3 contracts).
- we trade on 1% margin so deposit is $1,000 x 3 = $3,000 (that’s expressed in Position Value)

Profit =   3 * (1.2304 – 1.2154) * 100’000 = 4’500

So – the profit matches the results we’re getting by manual calculation.


2) Currencies denominated in a different currency from USD (assuming that your account is in USD)

AmiBroker allows you to define a base currency and exchange rates (fixed or dynamic) for different currencies, and as a result - to get correct backtest results when testing securities denominated in different currency than your base portfolio currency.

These settings can be defined in: Tools -> Preferences -> Currencies dialog.


AmiBroker allows to use both fixed and dynamic (historical) quotes for backtesting purposes (using dynamic quotes will allow you to check the real influence of the currency rates changes for your trades denominated in different currencies). 

There are following requirements to use currency adjustements:
a) Symbol->Information, “Currency” field shows currency different than BASE currency
b) Appropriate currency (defined in Symbol-> Information) has matching entry in Preferences->Currencies page
c) the dynamic rate “FX SYMBOL” defined in the preferences EXISTS in your database and HAS QUOTES for each day under analysis range.


“INVERSE” check box for in the preferences should be checked, when testing the FX rates like USDJPY or USDCHF – not denominated in the base currency of the portfolio.

For the same reason - if we look at the example of EURUSD – when “USD” is your BASE currency then EUR exchange rate would be “straight” EURUSD fx (e.g. ~1.25). But when “EUR” is your BASE currency then USD exchange rate would be INVERSE of EURUSD (i.e. ~1/1.25).

How to combine two databases into one

$
0
0

If you ever wondered how to combine two databases into one this short article will show you how, but let us start with some background first…

A database (or a workspace) is a directory that holds a set of binary files, which are stored in 0-9, a-z, ‘_’ subdirectories. Those binary files hold quotes, symbol information, your studies (trend lines, Fibonacci stuff). Each symbol’s information is stored separately in the file with the name of the ticker symbol located in the subdirectory corresponding to the first character of the symbol, so IBM quotation data/studies are stored in the ‘IBM’ file located in the ‘I’ subdirectory (more information on this in the User’s Guide).

In addition to these subdirectories and files, two additional files are also created by AmiBroker: broker.workspace and broker.master. The first is used to store category names and information about advancing/declining/unchanged issues. The latter stores the table of all symbols that is used for quick loading of the database. These two files are located in the root directory of each database, the ‘data’ directory, by default.

So – if one wants to combine two separate databases – there are the following possibilities:

  1. Export quotations from one database to the ASCII files and reimport quotes from another database (export procedure is described in the following article in the Knowledge Base http://www.amibroker.com/kb/2006/03/04/how-to-export-quotations-from-amibroker-to-csv-file/ )
  2. Just copy the data-files from one database folder into another (and place the files in their respective subfolders to keep the database structure the same). Then – it’s also necessary to delete the broker.master file from the target database – as a result AmiBroker will recreate the symbol list at startup and include all the new symbols in the database.

Setting up with FXCM (forex broker)

$
0
0

I have just prepared instructions how to connect to FXCM (Forex broker) to get their real-time quotes.
Also included is small example database (1 day worth of 1 minute data) and all required programs.

For the details check: http://www.amibroker.com/fxcm.html

How to display the indicators based on Advances/Declines

$
0
0

In order to display indicators based on Advances/Declines first of all it’s necessary to calculate composities in the database:

  1. Open Categories window using Symbol->Categories menu item.
  2. Select base index for given market in Markets tab and Base indexes for – Composites combo.
    For example if you are following NYSE this can by ^DIJ (Dow Jones Average)
    (certain symbol must be marked as index in Symbol -> Information and must belong to the same market)
  3. Choose Symbol ->Calculate composites  menu item to open the window shown below and mark:
    - Number of advancing/declining issues and
    - Apply to: all quotes, All markets
  4. Click Calculate . From now on ADLine, AdvVolume() and TRIN indicators will be visible.

Q: Why does AB need “base index”?
A: Just because it may happen that not all stocks are quoted every businness day and AB needs must calculate number of advancing/declining issues per market. So it checks the “base index” quotations dates and tries to find corresponding quotes of all stocks belonging to that market to find out how many issues advanced, declined and not changed at all.

Q: What are “Volume for base index” and “Copy volume to all indexes” checkboxes for?
A: “Volume for base index” and “Copy volume to all indexes” are provided in case you DON’T have real volume data for index quotes. In that case AmiBroker can calculate volume for index as a sum of volumes of all stocks belonging to given market. First option assigns calculated volume only to “base index”, the second copies the volume figure to all indexes belonging to given market.

AmiQuote and free data from Yahoo

$
0
0

There are a couple of things you need to know about Yahoo Finance pages that AmiQuote uses to download “historical” and “current” quotes.

Current quotes are quotes for current day (or previous day if there is no trading session today). For example MSFT current quote page is here:
http://finance.yahoo.com/q?s=MSFT
AmiQuote uses rather “download data” link which is: http://download.finance.yahoo.com/d/quotes.csv?s=MSFT&f=sl1d1t1c1ohgv&e=.csv
But it is not relevant because both show same current quote.

Now there is a second source. Historical quotes are downloaded from Historical Prices page. For example MSFT historical page is here: http://finance.yahoo.com/q/hp?s=MSFT (again AmiQuote uses rather plain text link: http://ichart.finance.yahoo.com/table.csv?s=MSFT&d=7&e=4&f=2007&g=d&a=2&b=13&c=1986&ignore=.csv )

Why using two sources? That’s simple: current mode gives data during trading session, while historical is only updated many hours after markets close so both compliment each other. Current mode is also much faster as it downloads as many as 200 symbols at once, while historical must download one by one. So recommended usage is to use Yahoo Current mode everyday, and Yahoo Historical once a week.
Of course you may use historical everyday as well if you have time and fast internet connection.

It is important to understand that AmiQuote is just the downloader (like Internet Explorer) and it does nothing except downloading the data, so if you belive that there is a bad quote – it is not AmiQuote, but rather Yahoo problem. To verify always go to relevant page (see links above) and check the quote on Yahoo Finance site directly.

It may happen that quotes on Yahoo Current page and Yahoo Historical pages differ. It is so because Yahoo gets them from different data vendors. If this happens the only solution is to report data error to Yahoo.

There are however 2 things you need to know about importing of data:

  1. AmiBroker by default imports split and dividend adjusted data (“Adj. Close” on Yahoo Historical page). For more information on how data are adjusted see Yahoo Help page at: http://help.yahoo.com/l/us/yahoo/finance/quotes/quote-12.html
  2. AmiBroker by default imports volume in HUNDREDS of shares (so if volume is 183,200 shares, the volume chart will show 1832). NOTE: This will NO LONGER apply in AmiBroker 5.30.

These things are adjustable, so if you don’t like them, you can change them.
The import process of historical quotes is controlled using aqh.format file that you will find inside “Formats” subfolder. By default it looks as follows (you can open it with Windows Notepad).

# AmiQuote historical quotes download format (.AQH extension)
$FORMAT Date_DMY,Open,High,Low,Close,Volume,AdjClose
$SKIPLINES 0
$BREAKONERR 0
$SEPARATOR ,
$DEBUG 1
$AUTOADD 1
$CONT 1
$GROUP 254
$VOLFACTOR 0.01

Lines marked with bold mark important areas.

$FORMAT line controls the import format. AdjClose field says that AmiBroker should use adjusted price. If you don’t want adjusted prices simply replace $FORMAT line with:

$FORMAT Date_DMY,Open,High,Low,Close,Volume
(note no AdjClose field)

$VOLFACTOR line controls the volume multiplier. If you want volume to be expressed in single shares instead of hundreds of shares replace $VOLFACTOR line with:

$VOLFACTOR 1

The same $VOLFACTOR change should be applied to aqd.format file that is responsible for importing data in Yahoo CURRENT mode (if you are using it).

How to change property for multiple symbols at once.

$
0
0

In order to automatically change a property for many symbols – instead of manual action in Symbol -> Information dialog one can use OLE automation.
For example – to unmark “Use only local database” option for all the symbols, it’s enough to run such SCAN:

– Analysis -> Formula Editor:
– enter:

AB CreateObject("Broker.Application");
st AB.Stocks(Name());
st.DataSource 0;
Buy 0;

– Tools -> Send to Auto-analysis
– Apply to: All Symbols, N-last quotations = 1
– press SCAN

The other example shows how to rename all the symbols and replace .TO suffix with -TC (this may be useful when we want to use the existing historical data with a new datasource which uses a different symbology).

– Analysis -> Commentary
– enter:

AB CreateObject("Broker.Application");
sts AB.Stocks();
Qty sts.Count;
for( Qty 1>= 0)
{
 st sts.Item);
 Ticker st.Ticker;  
 printf("changing " ticker "\n" );
 Length StrLen(Ticker );
 if( StrFind(ticker".TO") )
      st.Ticker StrLefttickerLength-3)+"-TC";
}

– press APPLY
– use: VIEW -> Refresh All to see the changes in the symbol tree.

CAVEAT: The commentary formula above iterates through ALL SYMBOLS in the database, therefore, if your database is big (has more than 100 symbols) it may be SLOW, and you may experience “not responding” message, but it is NORMAL. It does not mean that program has stopped working. It just means that it has not completed iteration yet. In that case just WAIT and don’t touch it.


How to backfill all symbols in RT database

$
0
0

Various data sources have different backfill capabilities, therefore the procedure to backfill all symbols varies. There are three categories of data sources, those that offer:

  1. unlimited backfills (eSignal, IQFeed),
  2. limited, 1-symbol at a time backfill (Interactive Brokers),
  3. no backfill at all (for example DDE)

As a general rule, all real-time data sources provide backfills on-demand, which means that backfill for each symbol has to be requested separately. If data source provides backfill and there are missing quotes in the database, AmiBroker will automatically request backfill on first access to given symbol. So, as soon as you display its chart fresh data will be requested and backfilled. Backfill is not immediate, because it is Internet-based process that involves request-response procedure, so data are requested from external server and arrive in a few seconds or so.
The same procedure is performed when doing any access including running Analysis, so backfill is requested as soon as given symbol is accessed, but by default Analysis window will not wait until backfill data arrive unless you turn on the Wait for backfill option (provided that data source supports it).

Wait for backfill option

It is worth to note that not all data sources support this feature. It needs to be handled by the data plugin, and many 3rd party plugins do not offer this.

If you are using eSignal or IQFeed or other data source with automatic, unlimited backfill you can use procedure described in How to use Real-Time data sources tutorial.

If you are using Interactive Brokers then the procedure is differnet since Interactive Brokers puts lots of limitations on backfills. To learn how to backfill all symbols using Interactive Brokers please read this dedicated tutorial on IB.

If you are using data source that does not offer any backfill, the only option is to use ASCII import to import the historical data from text files.

How to import huge ASCII files quickly

$
0
0

From time to time we are asked how to import large text (ASCII) files quickly. Normally speed is non-issue for ASCII import as it is blazing fast. That kind of question typically comes from person who wants to import hundreds of megabytes of data.

ASCII importer is optimized for adding new data to the existing database, so the most efficient operation is adding current quote (the newest one).

If you want to import huge amount of data in ASCII format in most efficient manner you need to make sure that the file you are importing is sorted

  1. in ascending symbol order (so “AAPL” before “INTC”), and within symbol
  2. in ascending chronological order (so oldest records first, newest records last)

In SQL query talk it would be “ORDER BY Symbol ASC, Date ASC”.

Doing so ensures that no sorting is required during import and symbol shuffling is reduced to minimum, so in-memory cache is used most efficiently.

If your file is not ordered or ordered in reverse then it takes long to import because AB must shuffle data. In worst case scenario (newest records first), every data insert involves sorting which makes it a killer. The difference can be hours vs seconds on properly sorted file.

How to combine data from multiple input files

$
0
0

Sometimes it is useful to update existing database with quotes from other source and sometimes we just want to update one data field, leaving other unaffected. For example we may want to import data into Aux1 and Aux2 fields leaving regular OHLC prices untouched.

This post will show how to use $HYBRID mode of ASCII importer to combine data from multiple input files.

When we use Import Wizard / Import ASCII features to import quotations, by default the importer expects Close prices to be present in the imported data. There are some situations however when it would be convenient to import data just to one field (e.g. Aux1) if we have some additional values that we want to store in the database.

Of course, one way would be to combine all these quotes in a single file before the import and process in one run – but ASCII importer allows also to use special $HYBRID mode to import such partial data.

As an example, let us consider a situation where we already have adjusted OHLC quotes imported into the database and we have a file containing unadjusted quotes in the following format:

Ticker,Date,Aux1
AAPL,13-10-2014,99.81
AAPL,10-10-2014,100.73
AAPL,09-10-2014,101.02
AAPL,08-10-2014,100.80
AAPL,07-10-2014,98.75
AAPL,06-10-2014,99.62
AAPL,03-10-2014,99.62
AAPL,02-10-2014,99.90
AAPL,01-10-2014,99.18
AAPL,30-09-2014,100.75
AAPL,29-09-2014,100.11

In order to import those quotes into Aux1 field and combine with existing data, go to File->Import Wizard menu, pick the file and define format the following way:

ASCII import wizard

First we need to define columns so they match the format of input data (in this case set first three columns to Ticker, DMY, Aux1 and the rest to Skip).

To activate special hybrid mode we need to type:

$HYBRID 1

into Additional Commands box and since we are not importing regular prices that include Close array, we also need to mark Allow negative prices.

If instead of using the wizard we create import definition file manually, then it should contain:

$HYBRID 1
$ALLOWNEG 1

Now we can verify the results in Symbol->Quote Editor. The OHLC fields still contain adjusted values, while additional data has been properly stored in Aux1 field without affecting the other fields.

Quote Editor

For more information about Import Wizard and ASCII importer please check the following parts of the User’s Guide:
http://www.amibroker.com/guide/w_impwizard.html
http://www.amibroker.com/guide/d_ascii.html

How to correct forward looking timestamps

$
0
0

Some platforms, like Tradestation, use “future looking” timestamps in their data so for example 5 minute bar covering market activity from 9:30:00 till 9:34:59 is stamped with 9:35:00 (future time – see Tradestation manual explaining their timestamps) so their data have a kind of future offset.

AmiBroker, on the other hand, uses and expects natural timestamping, in which data from 9:30 are marked with 9:30 timestamp, so data from 9:30:00 until 9.34:59 belong to 9:30 5-minute bar.

If you want to use future-timestamped data in AmiBroker you need to remove the offset.

To do so, you need to shift the timestamps back by the amount equal to the base data interval during import process. In case of 5-minute bars, you need to shift data by -5 minutes.

To shift the data during import you can use $TIMESHIFT command of ASCII importer, see http://www.amibroker.com/guide/d_ascii.html

$TIMESHIFT offset_in_hours

the offset_in_hours parameter defines the time in hours that should be added to imported timestamps. You can use negative and fractional values too. Each minute is 1/60 of hour so shifting back by 1-minute would be -0.01666667.

If you are using ASCII Importer Wizard, and want to import 5-minute data with future looking timestamps, you can simply type the following in the “Additional commands” box of ASCII Importer Wizard.

$TIMESHIFT -0.08333333333333

-0.08333333 is a result of dividing 5 by 60 (number of minutes in an hour)

Please find out what time-stamping method is used by your data provider because it is important to know that to get your higher-interval charts right.

How to find correct symbol for Interactive Brokers data

$
0
0

Sometimes Interactive Brokers symbology may be difficult to figure out. It is however very easy to find out proper symbol using Contract Description window in the TWS.

The general format for symbols that AmiBroker uses to access Interactive Brokers’ data is:

SYMBOL-EXCHANGE-TYPE-CURRENCY

The symbols must be entered in UPPER case. CURRENCY may be skipped if it is USD. TYPE can be skipped if it is STK (stock). EXCHANGE can be skipped if it is SMART.

To find correct symbol using TWS follow these steps:

  1. Select desired symbol in TWS
  2. Click on the line with right mouse button and select Contract Info->Description menu

    TWS Contract Description menu

  3. Now read the values from the Description window and use them to build proper symbol for IB plugin

    TWS Contract Description window

As per rules mentioned above, if CURRENCY is USD it may be skipped so we can use either ESZ4-GLOBEX-FUT-USD or ESZ4-GLOBEX-FUT.

For non-US symbols the procedure is the same, so TESCO PLC would be TSCO-SMART-STK-GBP. In this case we can not skip SMART and STK because we need to specify currency, and it is 4th part of the symbol. If we skipped SMART and STK, IB plugin would think that GBP is second part of dash delimited string and interpret it as exchange, and this is NOT what we want.

How to verify if EOD data is available for download at Google Finance

$
0
0

AmiQuote downloader allows to get free quotes from a number of sources included Google Finance. AmiQuote works like a specialized web-browser, so the quotations can be downloaded if they are accessible at the website of that particular data-vendor. In case of Google Finance downloads, not every symbol that is present on their site is available for historical download.

Google Finance page does NOT allow downloading historical data for non-US (international) symbols and some indices.

If you have trouble downloading particular symbol (you are getting errors in AmiQuote), chances are that Google Finance does not allow downloading data for this symbol. To verify that we need to look for Download to spreadsheet link on Google Finance page as instructed below:

  1. Visit http://finance.google.com/
  2. Use Search field to find the symbol we need, e.g. MSFT
  3. Go to Historical Prices section and look for Export: Download to spreadsheet

Historial Prices

If Export: Download to spreadsheet is present, it means that historical data are available for download. If the link is NOT present – it means no data for download. As you can see in the picture below, the link is present for US stocks like MSFT:

Historial Prices

But Download to spreadsheet link is missing for SP500 and PLC (Traded on London Exchange) – as you can see using these two links:
Historical Prices page for SP500 (no download link)
Historical Prices page for TESCO, PLC (no download link)

Importing data using multiple column separators

$
0
0

When we import data from ASCII (plain text) files, sometimes the data in the input files are arranged in columns separated by different characters. This article shows how to configure Import Wizard / ASCII Importer to import such data correctly.

Let us consider data file using the following format

Ticker,Date/Time,Open,High,Low,Close,Volume
EURUSD,2011-06-13 20:19:00,1.4421,1.4421,1.4419,1.4419,332
EURUSD,2011-06-13 20:20:00,1.4419,1.4419,1.4418,1.4418,298
EURUSD,2011-06-13 20:21:00,1.4418,1.4418,1.4416,1.4417,192

In this sample data file columns are separated with a comma, with one exception – date and time columns are combined together, with a space in between. ASCII importer requires us to specify Date and Time columns separately. Fortunately – there is a way to treat space and comma both as separators at the same time.

To configure Import Wizard, we need to specify columns to match the input data, treating Date and Time as two separate columns (Column 2 and Column 3 in this case), additionally we need to set Separator field as Comma or Space, so the importer would properly recognize space as a character delimiting the new column.

Import Wizard

This way our data will be imported properly. There are also other multiple separator choices available in the Import Wizard, such as Tab or Space and Semicolon or Space that can be used if your data file uses tabs or semicolons as primary column separator.

If we build our import definition file manually for ASCII importer, we can also specify multiple separators, by enclosing the required characters in quotation marks in $SEPARATOR command. The equivalent format definition for the above input data would look like this:

$FORMAT Ticker, Date_YMD, Time, Open, High, Low, Close, Volume
$SKIPLINES 1
$SEPARATOR ", "
$CONT 1
$GROUP 255
$AUTOADD 1
$DEBUG 1

More information about ASCII importer and Import Wizard functionalities can be found in the manual:
http://www.amibroker.com/guide/w_impwizard.html
http://www.amibroker.com/guide/d_ascii.html


How to delete quotes without removing the symbol from a database

$
0
0

In order to delete quotations from a local database manually, we can use Quotations Editor (Symbol–>Quote Editor), then mark the required range of quotes and press Delete button. To mark a range – it is enough to click on the first line of the range, then scroll to the other line, hold SHIFT and click on the end-line of the range. To multi-select individual lines, hold down CTRL key while clicking on the lines.

Delete quotes

There is also a way to delete quotations programmatically with use of OLE automation interface explained here:

http://www.amibroker.com/guide/objects.html

The following code presents how to do it using automation scripts (the code deletes all quotations of MSFT ticker):

// THIS IS NOT AFL
// This is Windows script to be run from the outside of AmiBroker
function RemoveAllQuotes( Name )
{
    AB = new ActiveXObject("Broker.Application");
    Stk = AB.Stocks( Name );
    Quotes = Stk.Quotations;
    iQty = Quotes.Count;
    for( i = iQty - 1; i >= 0; i-- )
    {
       Quotes.Remove( i );
    }
    AB.RefreshAll();
}
RemoveAllQuotes("MSFT");
WScript.Echo ( "Completed" );

The code above is intended to be used from the outside of AmiBroker.

To use above code follow these steps:

  1. Open Notepad
  2. Copy-paste above the code
  3. Save the file with .JS extension (which means that system will treat this as JScript code)
  4. Make sure that AmiBroker is running with desired chart as active one
  5. Double click on .JS file to execute the JScript code

IMPORTANT: if you are running 64-bit Windows and have BOTH 32-bit and 64-bit versions of AmiBroker installed the OLE scripts by default would only talk to 64-bit instance. To use 32-bit version instead you would need to follow advice given in this article: “Running OLE automation scripts with 32- and 64-bit versions of AmiBroker”

Using the very same method you can delete quotes selectively, for example the script below deletes only quotes having zero volume:

// THIS IS NOT AFL
// This is Windows script to be run from the outside of AmiBroker
function RemoveQuotesWithZeroVolume( Name )
{
     AB = new ActiveXObject("Broker.Application");
     Stk = AB.Stocks( Name );
     Quotes = Stk.Quotations;
     iQty = Quotes.Count;
     cnt = 0;
     for( i = iQty - 1; i >= 0; i-- )
     {
        qt = Quotes.Item( i );
        if( qt.Volume == 0 ) 
        { 
           cnt++;
           Quotes.Remove( i );
        }
     }
    
     AB.RefreshAll();

     return cnt;
}
n = RemoveQuotesWithZeroVolume("MSFT");
WScript.Echo ( "Removed " + n + " quotes with zero volume" );

Choosing compression method for Aux1 and Aux2 fields

$
0
0

Apart from regular Open, High, Low, Close, Volume, OpenInt fields – AmiBroker database allows to store custom data in auxiliary fields called Aux1 and Aux2. This allows to import our custom arrays and store in the database.

Since the data stored in those fields will vary, depending on the actual records imported in there – then in case of time-compressed intervals we may need to determine how exactly these values are compressed if we e.g. switch from Daily to Weekly interval. By default these values would get compressed the same way as Close field, i.e. Last value from given period would be used. We can however choose specific compression method if we need these fields to behave differently (for example like Volume, where weekly record represents a Sum of daily volumes).

The compression mode for Aux1 and Aux2 can be defined in File->Database Settings->Intraday Settings dialog Aux1,2 aggregation mode field:

Aux compression mode

Importing auxilliary data into AmiBroker database

$
0
0

AmiBroker database structure offers the following fields: Open, High, Low, Close, Volume, OpenInt, Aux1, Aux2. The last two fields, i.e. Aux1 and Aux2 are meant for storing any custom historical data-arrays we may need.

Pretty often, we already have quotations data present in the database and we just want to put some extra data into auxiliary fields. To combine existing data with imported data, we can need to use hybrid mode. In the Import Wizard just add this command in “Additional commands’ field.

# This example assumes that file has format: 
# Symbol, Year-Month-Day, auxiliary_data1, auxiliary_data2
$FORMAT Name, Date_YMD, Aux1, Aux2
$HYBRID 1
$ALLOWNEG 1

Hybrid mode works so that with each imported record it looks for matching record in the database and it combines existing data with data being imported. If OHLC prices are not provided in the imported file you need to specify $ALLOWNEG 1 option. Otherwise you would get error messages about missing close price.

Auxiliary data fields can then be read using simply Aux1 and Aux2 identifiers:

PlotAux1"Aux1"colorRed );

However – if two additional fields are not enough for our purposes, we can also import quotes into some synthetic tickers and have another set of OHLC, V, OI, Aux1 and Aux2 fields available for importing. Synthetic ticker in this context means just a custom symbol name that’s used just for storing such extra data. So – instead of importing additional arrays into IBM ticker or AAPL ticker, we could use for example IBM_extra and AAPL_extra symbols and their fields.

Using such common naming pattern (i.e. identical ‘_extra’ suffix with the original ticker name) will be useful, because later on to access data from the selected field we could use just the following AFL call:

myVal ForeignName() +"_extra""C");

and this line will read value from Close field of the respective ‘extra’ ticker as we select IBM or AAPL.

An alternative way to store and handle several custom arrays would be to use SQL database, then we could use ODBC plugin to read such data. The documentation of ODBC plugin is available at:

http://www.amibroker.com/odbc.html

How to re-import the same data without downloading them again

$
0
0

If we have already downloaded several years of historical data using AmiQuote and for any reason we need to re-import this data once again (e.g. into a new database) – there is a way to avoid re-downloading the whole history.

AmiQuote stores all downloaded data files inside of the dedicated destination folder. The exact location can be checked from AmiQuote: Tools->Settings menu:

AmiQuote settings

All recently downloaded files are stored in this folder and we can use ASCII importer in AmiBroker to pick these files manually for import. To do that please follow the steps below:

  1. Select File->Import ASCII
  2. In the open file dialog navigate to Download folder
  3. From Files of type field pick correct import definition to match the source used in AmiQuote:
    Import ASCII
  4. mark the .AQH files we want to import (to select all, it is enough to click on any of the files and hit CTRL+A, multiple file selection is also possible by clicking with CTRL or SHIFT keys pressed)
  5. press Open button to start import procedure

It is important to remember that by default each new download via AmiQuote overwrites the earlier files, so the AQH files will contain quotes from the very last download for given symbol.

More information about using ASCII importer can be found here:
http://www.amibroker.com/guide/h_amiquote.html
http://www.amibroker.com/guide/d_ascii.html

How to backup data from an external source

$
0
0

There is a number of data-plugins, where AmiBroker reads quotes directly from an external database maintained by the data-vendor (such as TeleChart, FastTrack, PremiumData or other MetaStock-based sources). Depending on settings, AmiBroker may or may not keep a copy of such data in its own database. For in-depth explanation how it works see the following tutorial chapter:

http://www.amibroker.com/guide/h_workspace.html

Now, if we want to backup the data from an external data source, and use them offline, first we need to make sure that actual data are copied into AmiBroker’s local database.

To do so, first go to File->Database Settings set Local Data Storage to Enabled. This instructs AmiBroker to keep its own copy of retrieved data.

Database Settings

At this point the data are not copied yet. In order to bring them from external data source to AmiBroker local database, we need to make sure that AmiBroker accesses quotes of all symbols at least once. Only then external source will be queried for data and that data will be copied to a local database. The easiest way to do so is to run a Scan from Analysis window over all symbols, using any scanning formula, even as simple as:

Buy 0;

Such single-line of code can be entered in the Formula Editor, then selecting Tools–>Send to Analysis menu would bring up the Analysis window. At this point just make sure that Apply To is set to All Symbols and press Scan.

After this the data is copied to local database. If you want to completely disconnect from external data source, you can do so by changing Data source to “(local database)” in File->Database Settings. This would allow you to use the data on a different computer. Now you can do File->Save Database As… to store the database into new location (or backup drive).

If you want to re-connect to external data source, just switch the Data source back to original setting (i.e. the data plugin you were using before).

Viewing all 30 articles
Browse latest View live